SUBHEX
Web-based dashboard for subscription management
Exploring the creative constraint of unifying themesOVERVIEW
SUBHEX is a dashboard redesign / data visualization project. I also call it “The Journey of Kindergarten Artwork”. It is an area that I am interested in but lack the audacity to get my hands on knowing its complexity and depth. I decided to go with this project while having other “fun” options because I wanted to try how far I can stretch with my design intuition and current analytical skills. The process of this project enlightened me in many different aspects. And I fell in love with this new perception that data visualization is like visual poem.
ROLE
Sole Product Designer, UX/UI Design, Branding
TIMELINE
1 month / Nov 2022
PROJECT TYPE
Personal Project
BACKGROUND
“Scattered and complex information can easily overwhelm us. It could be difficult to organize if you are not an ‘excel master’, not to mention making smart decisions for it.”
Subscription management is something that sounds effortless, but is actually a hectic task to keep track of. To solve this problem, I focused on creating an easy-to-start-with system and a leisurely interface. I rebranded and redesigned all existing website pages with the improvements on data visualization.
BUSINESS GOALS
As a current user, I want to see all of my subscriptions in one place so that I can get a comprehensive view of my spending on subscriptions.
As a returning user, I want to unsubscribe from a subscription so that I can reduce needless spending.
As a consumer, I want to be notified if any of my subscriptions are about to be auto-renewed. So that I can make a decision about whether to continue or unsubscribe.
SCOPE / DELIVERABLES
Restructure existing wireframes and add new feature based on needs
Build mobile version of the product
Rebranding for the company (self-added)
RESEARCH
Considering the scope and timeline, I decided to study three industry examples and find out what are some of the drawbacks of the same kind of product. I noticed three major problems:
Pages can be over-loaded with information.
Missing clear direction on the key tab.
No further suggestions based on the known information.
And they all streamed down to one question.
How might we enhance the presentation and navigation, in order to help users make better and quicker decisions on subscription plans?
SOLUTION
The possibility beyond “The existing”
IDEATION
Working backward and Thinking forward
In order to have a better understanding of what users actually need to view on each page. I traced-back and recreated this “Unsubscribe flow” based on the given wireframes. Two questions come to my mind while I was sketching:
What’s the information hierarchy for users?
How to present data and its history in a more “welcoming way”?
By focusing on three key aspects for the design: Explore, Monitor and Explain. My interpretations are:
Users should be able to view data in different forms and in both breadth and depth.
Users should be able to track the timeline with related details for their subscriptions.
Dashboard should provide information beyond “what” in order to help users understand “why” and make quicker decisions.
↑ User FlowVISUAL DESIGN
Make “analysis” less daunting
In order to differentiate SUBHEX in the competitive finance dashboard market, I believe branding plays a key part of the project. It’s not enough to only meet the needs of current users, but also expand the potential market (especially now we are gonna build a mobile version). Welcoming colors and fun widgets in the interface design will help users to build confidence analyzing numbers and have a continuing interest in using the product.
My goal is to lower the threshold for starting to use a finance management product
Aim to attract younger users and finance newbies
USER TEST ROUND 1
The presentation of “Kindergarten Artwork”
Here is where the term came from when one of the participants (my friend) commented on the design of analysis graph - “This kinda looks like Kindergarten Artwork.” Which made me cackled. (Of course, he explained his reason.) And…actually out of doubt, I agreed with him and decided to use it along my journey of this project.
A reminder for myself - Think again about what I see and what users see
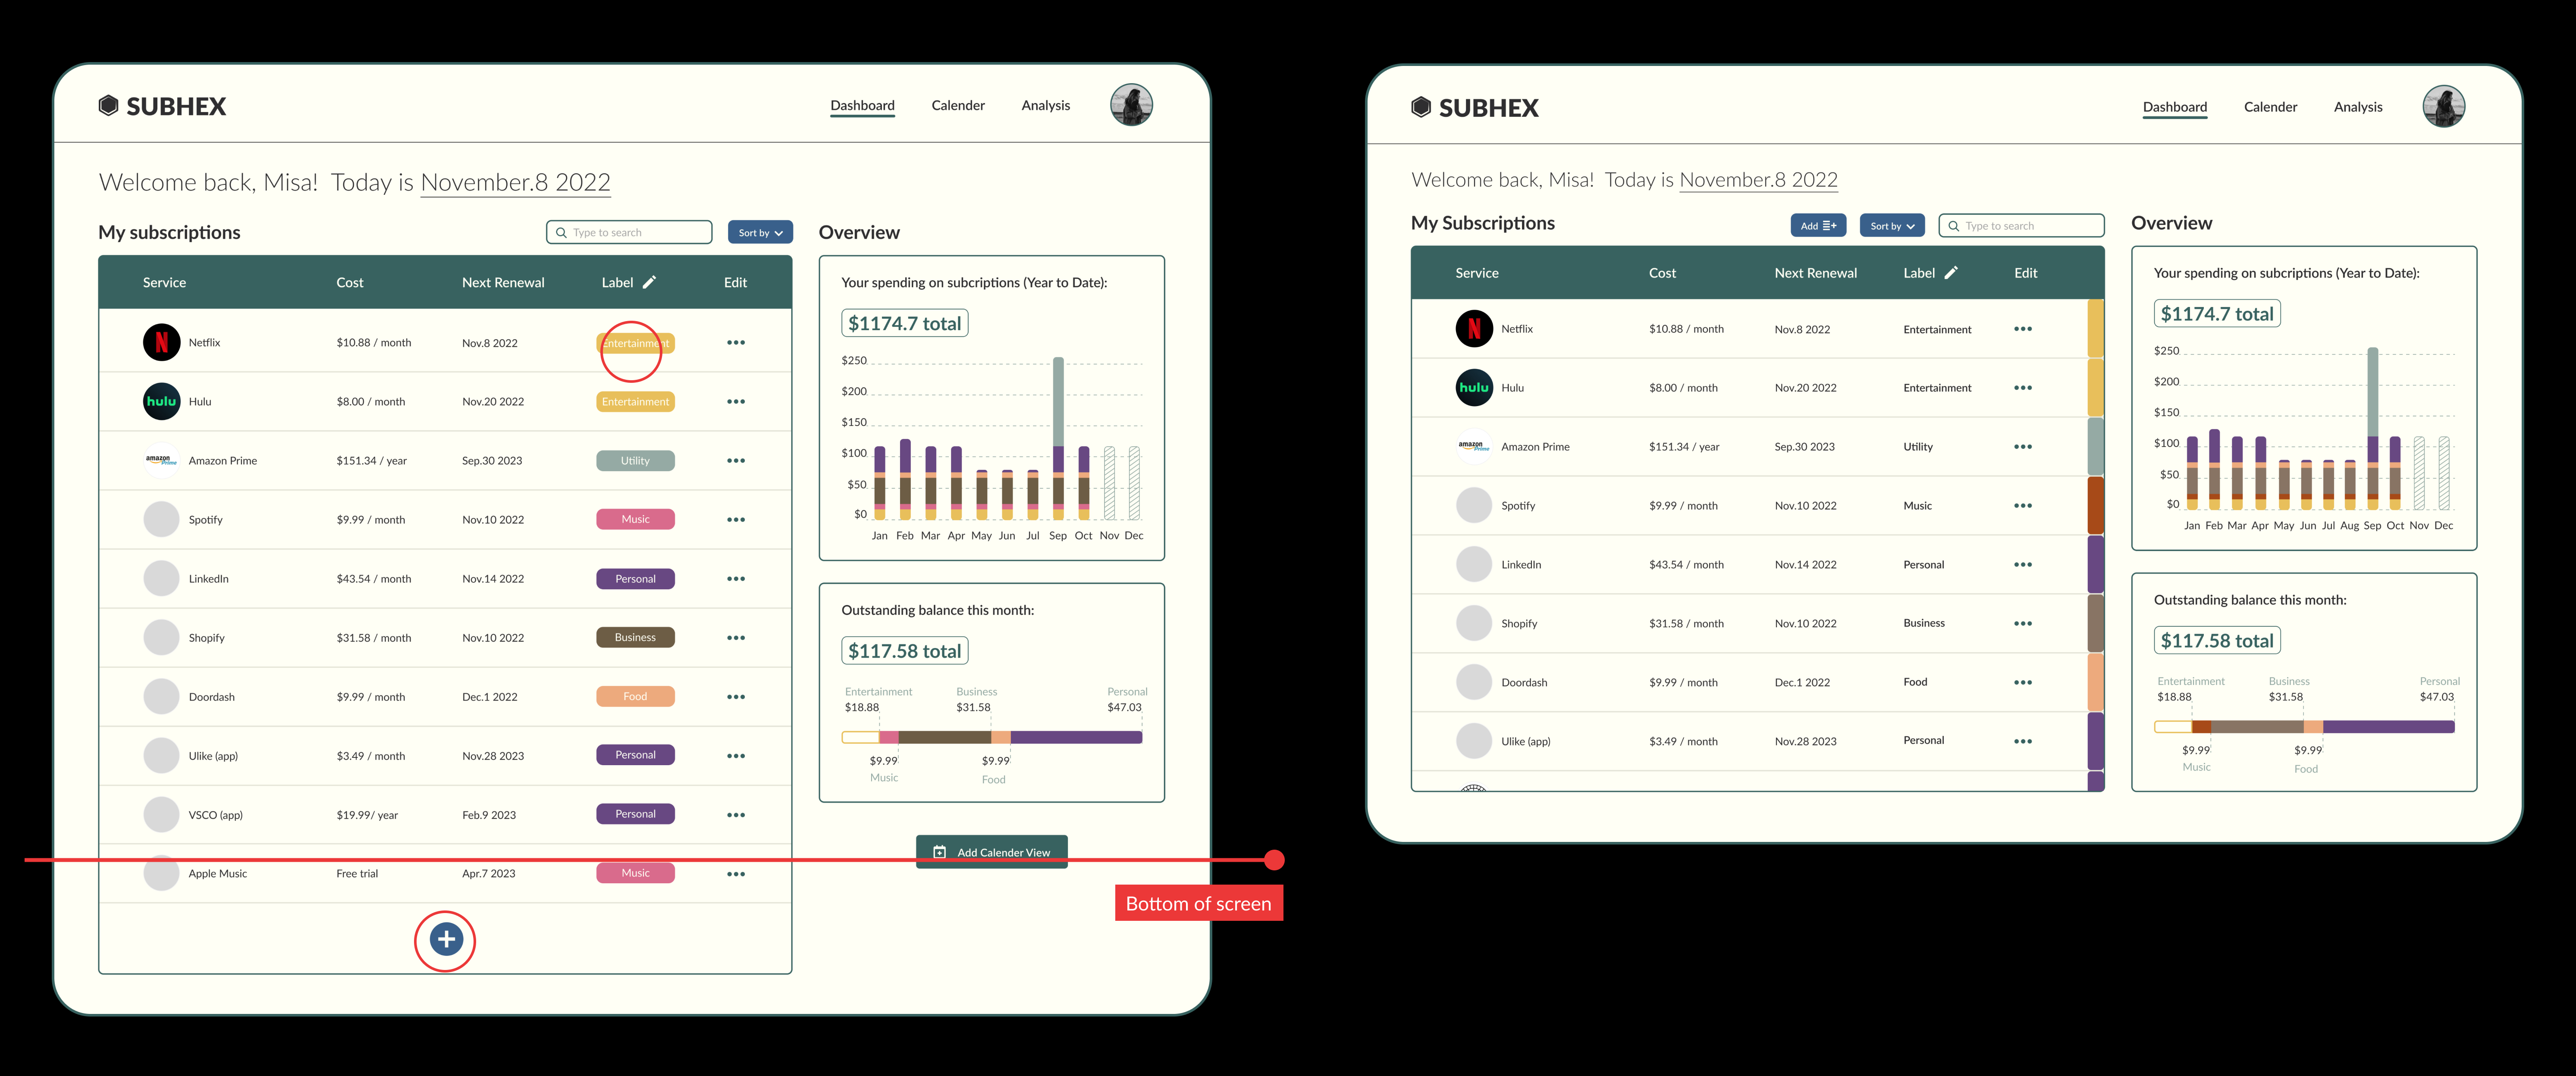
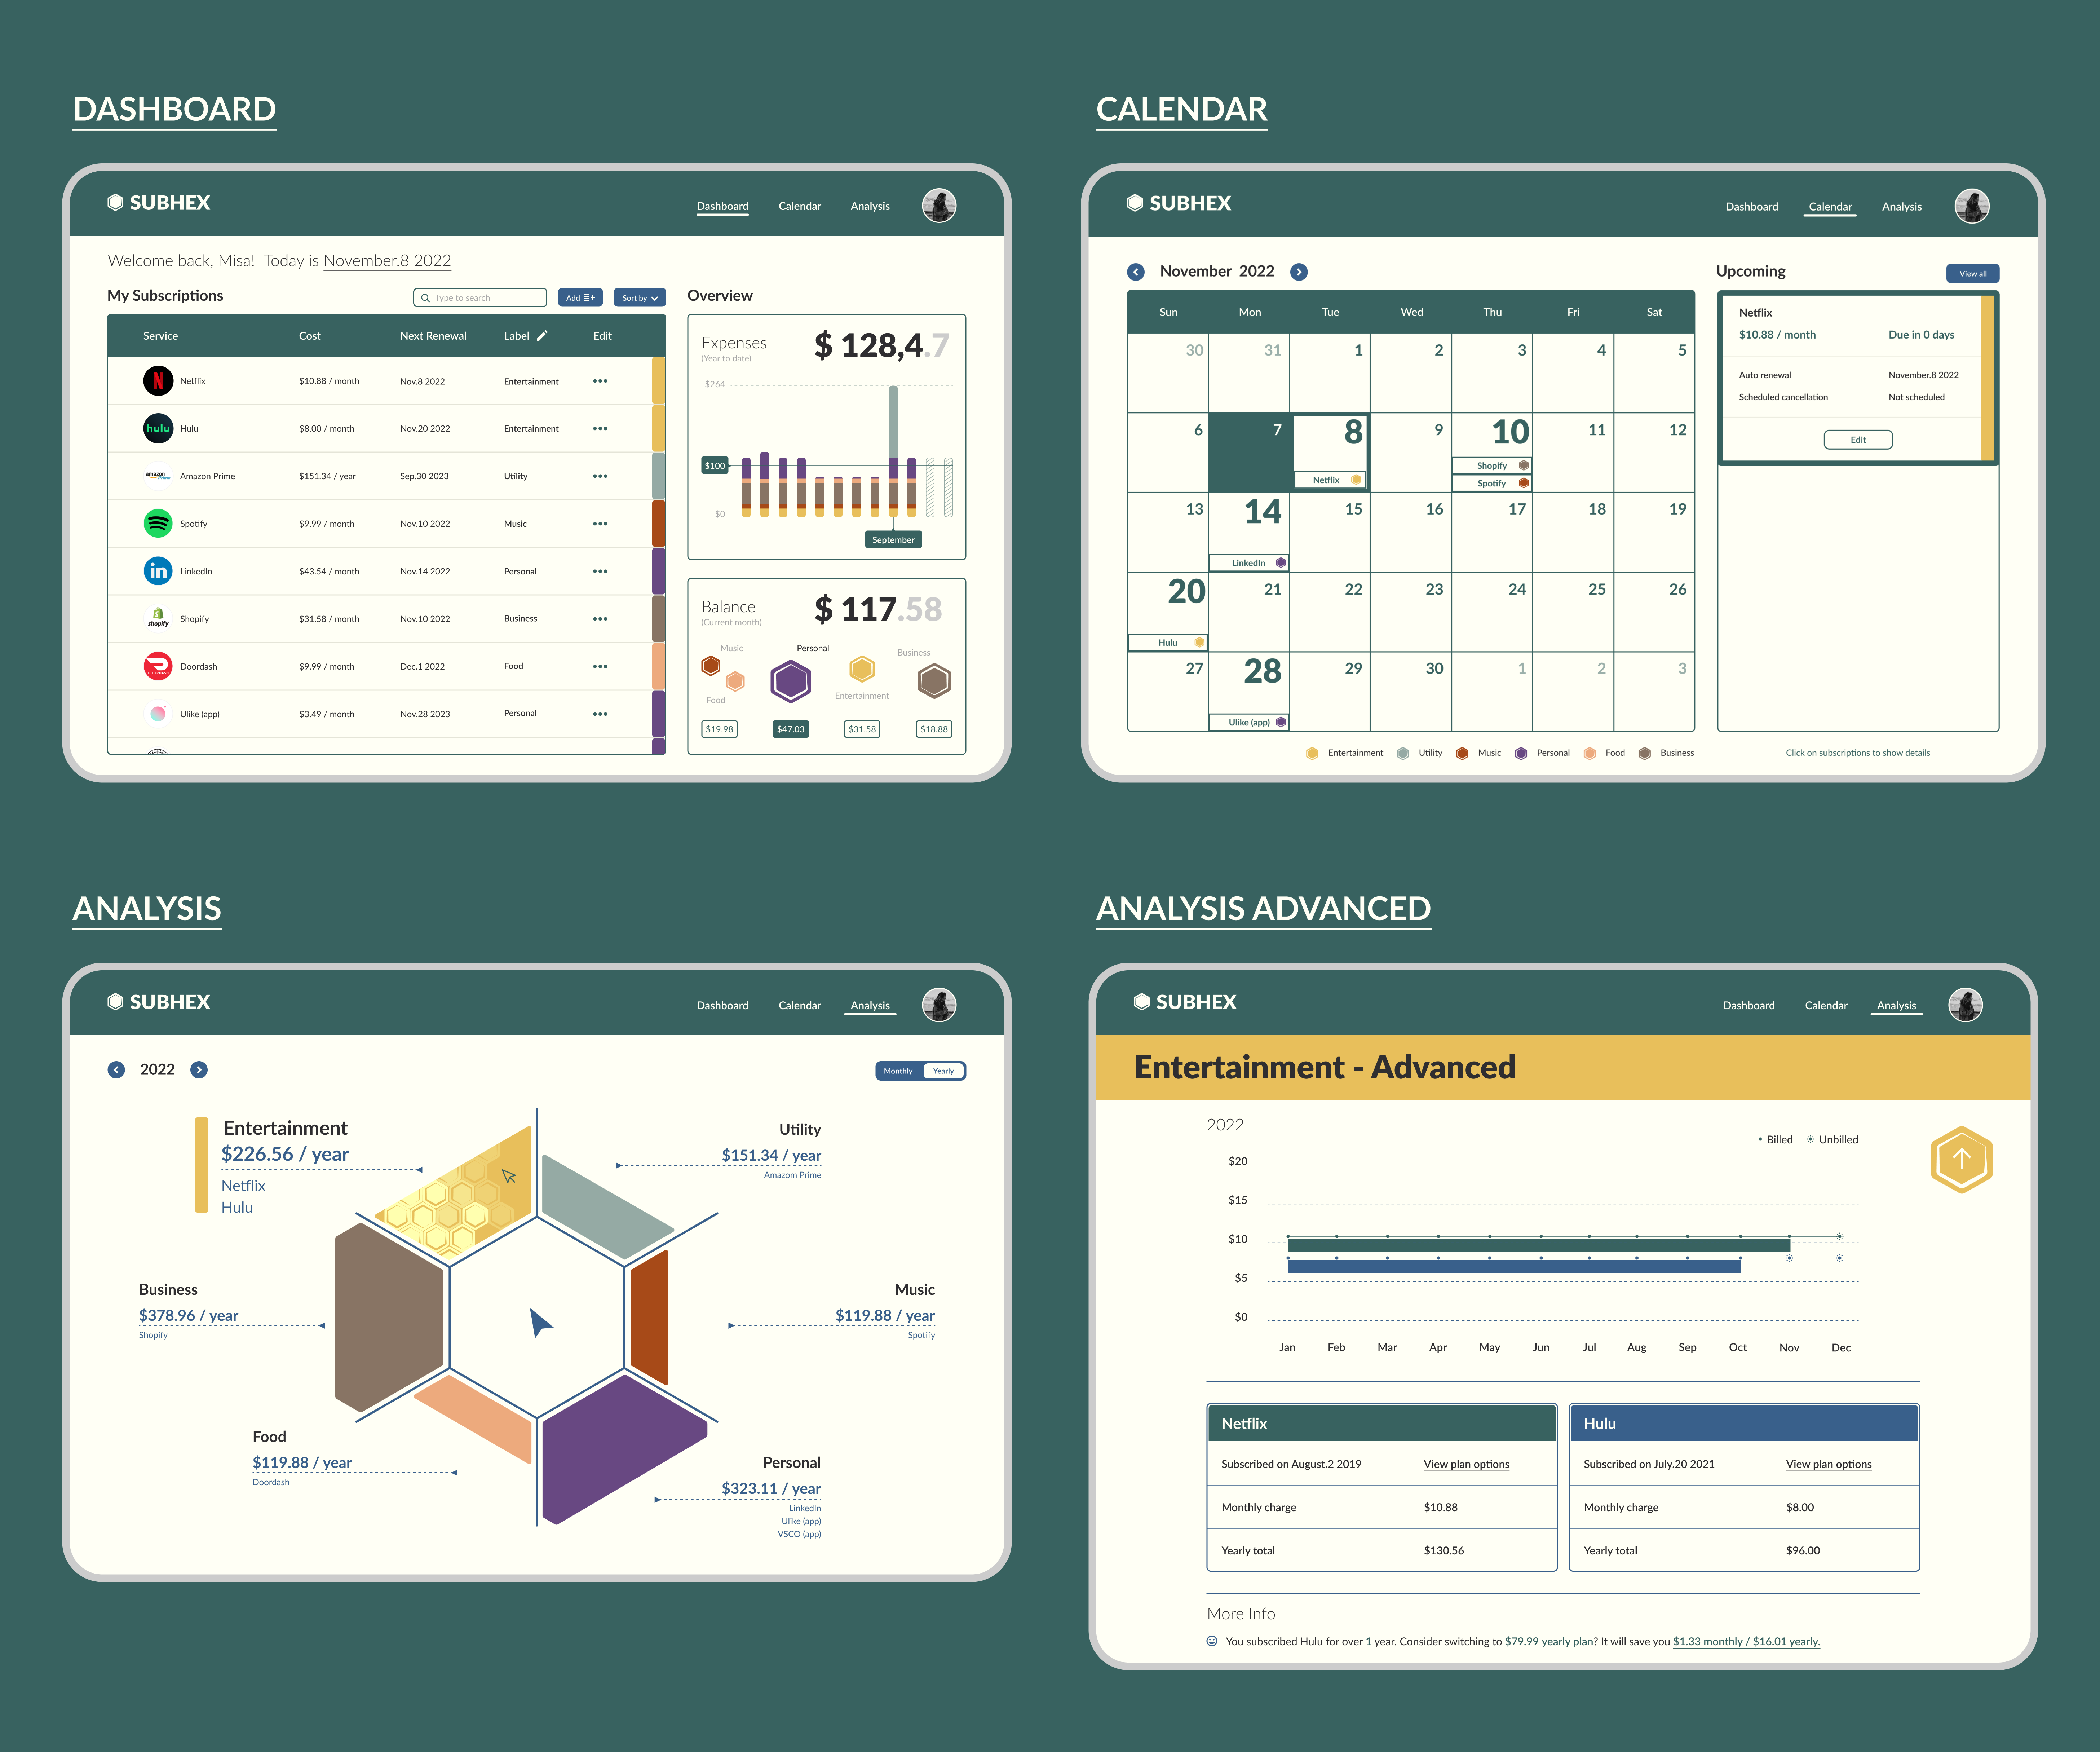
↑ DASHBOARDUsers prefer all widgets to be aligned and no extra scrolling for adding new subscriptions. I also changed the design for the colored label due to accessibility concern.
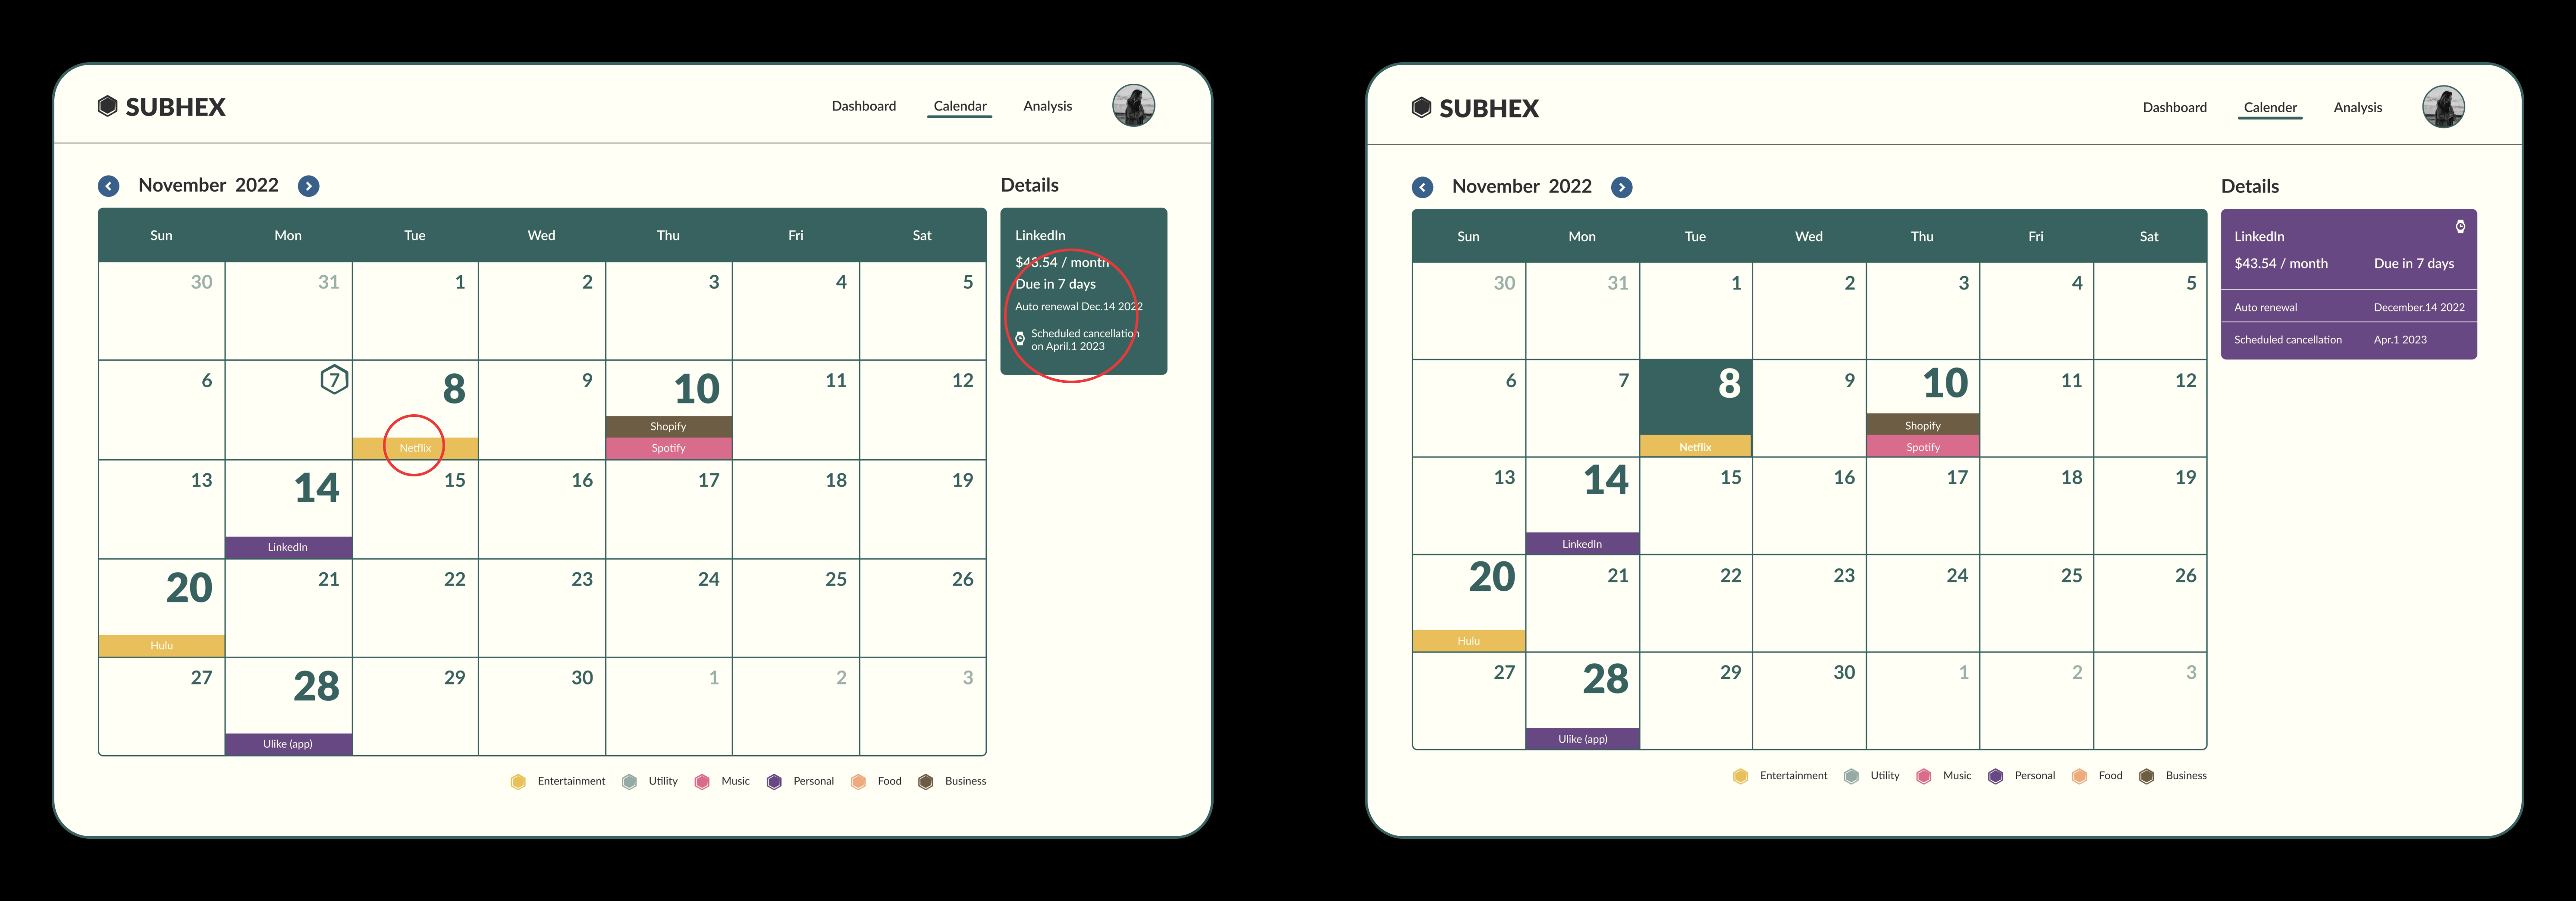
↑ CALENDARThe “Detail” section is hard to read due to the size, as well as subscriptions color block. I revised the calendar cell background to be darker. Expanded the size of the “Details” section. And changed its background to match back with category’s color code as a 2nd reminder. Still considering users feedback of adding “unsubscribe” function on this page.
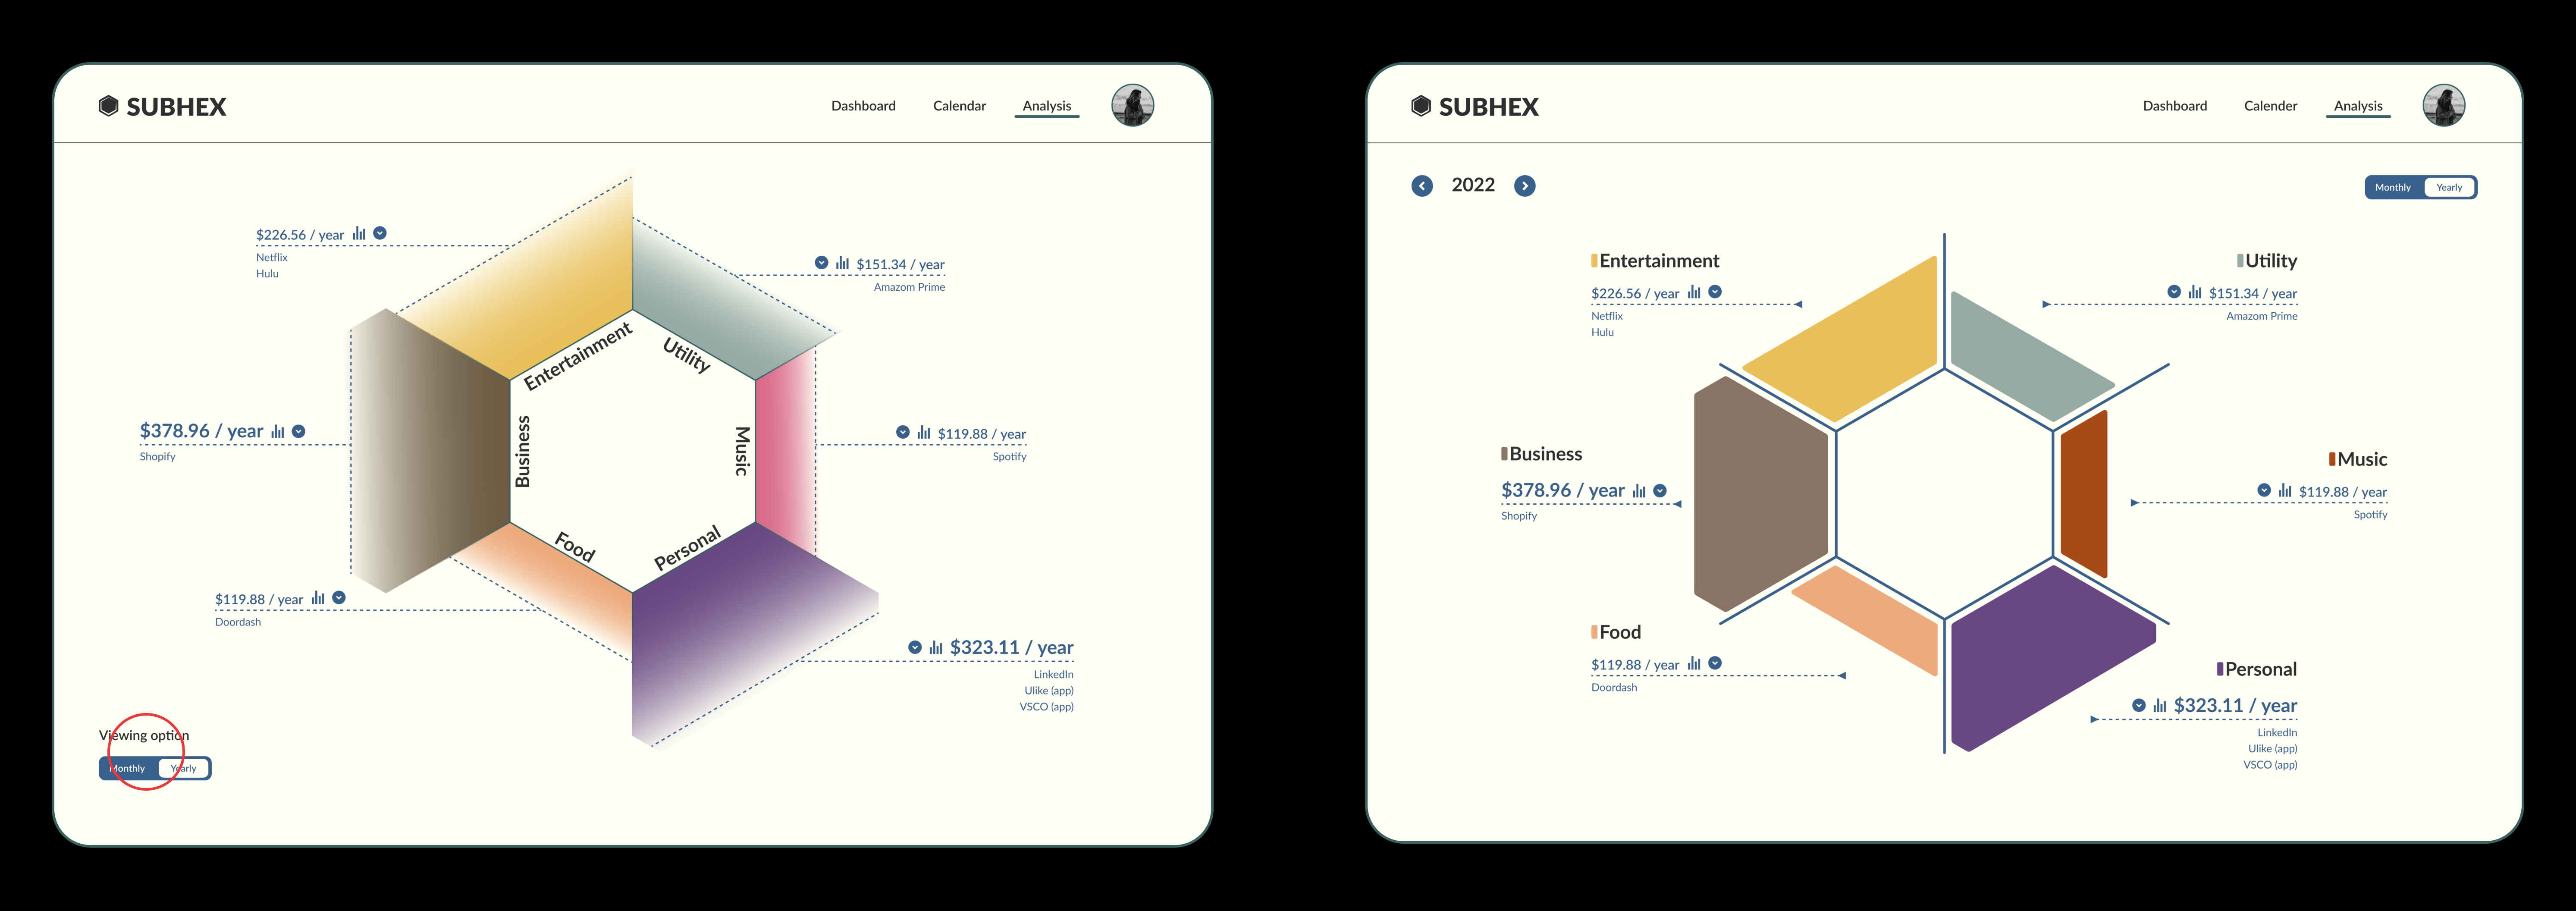
↑ ANALYSIS (My Kindergarten Artwork)The design of the graph got roasted in the first round of test (lol)- The awkward fading effect; words floating in the middle of nowhere; unnecessary dash lines… And the size is not visually balanced with other elements on this page. New graph fixed those “problems with a much cleaner look. Also adjusted the (random) placement of “viewing options” toggle to be the same as other page’s buttons.
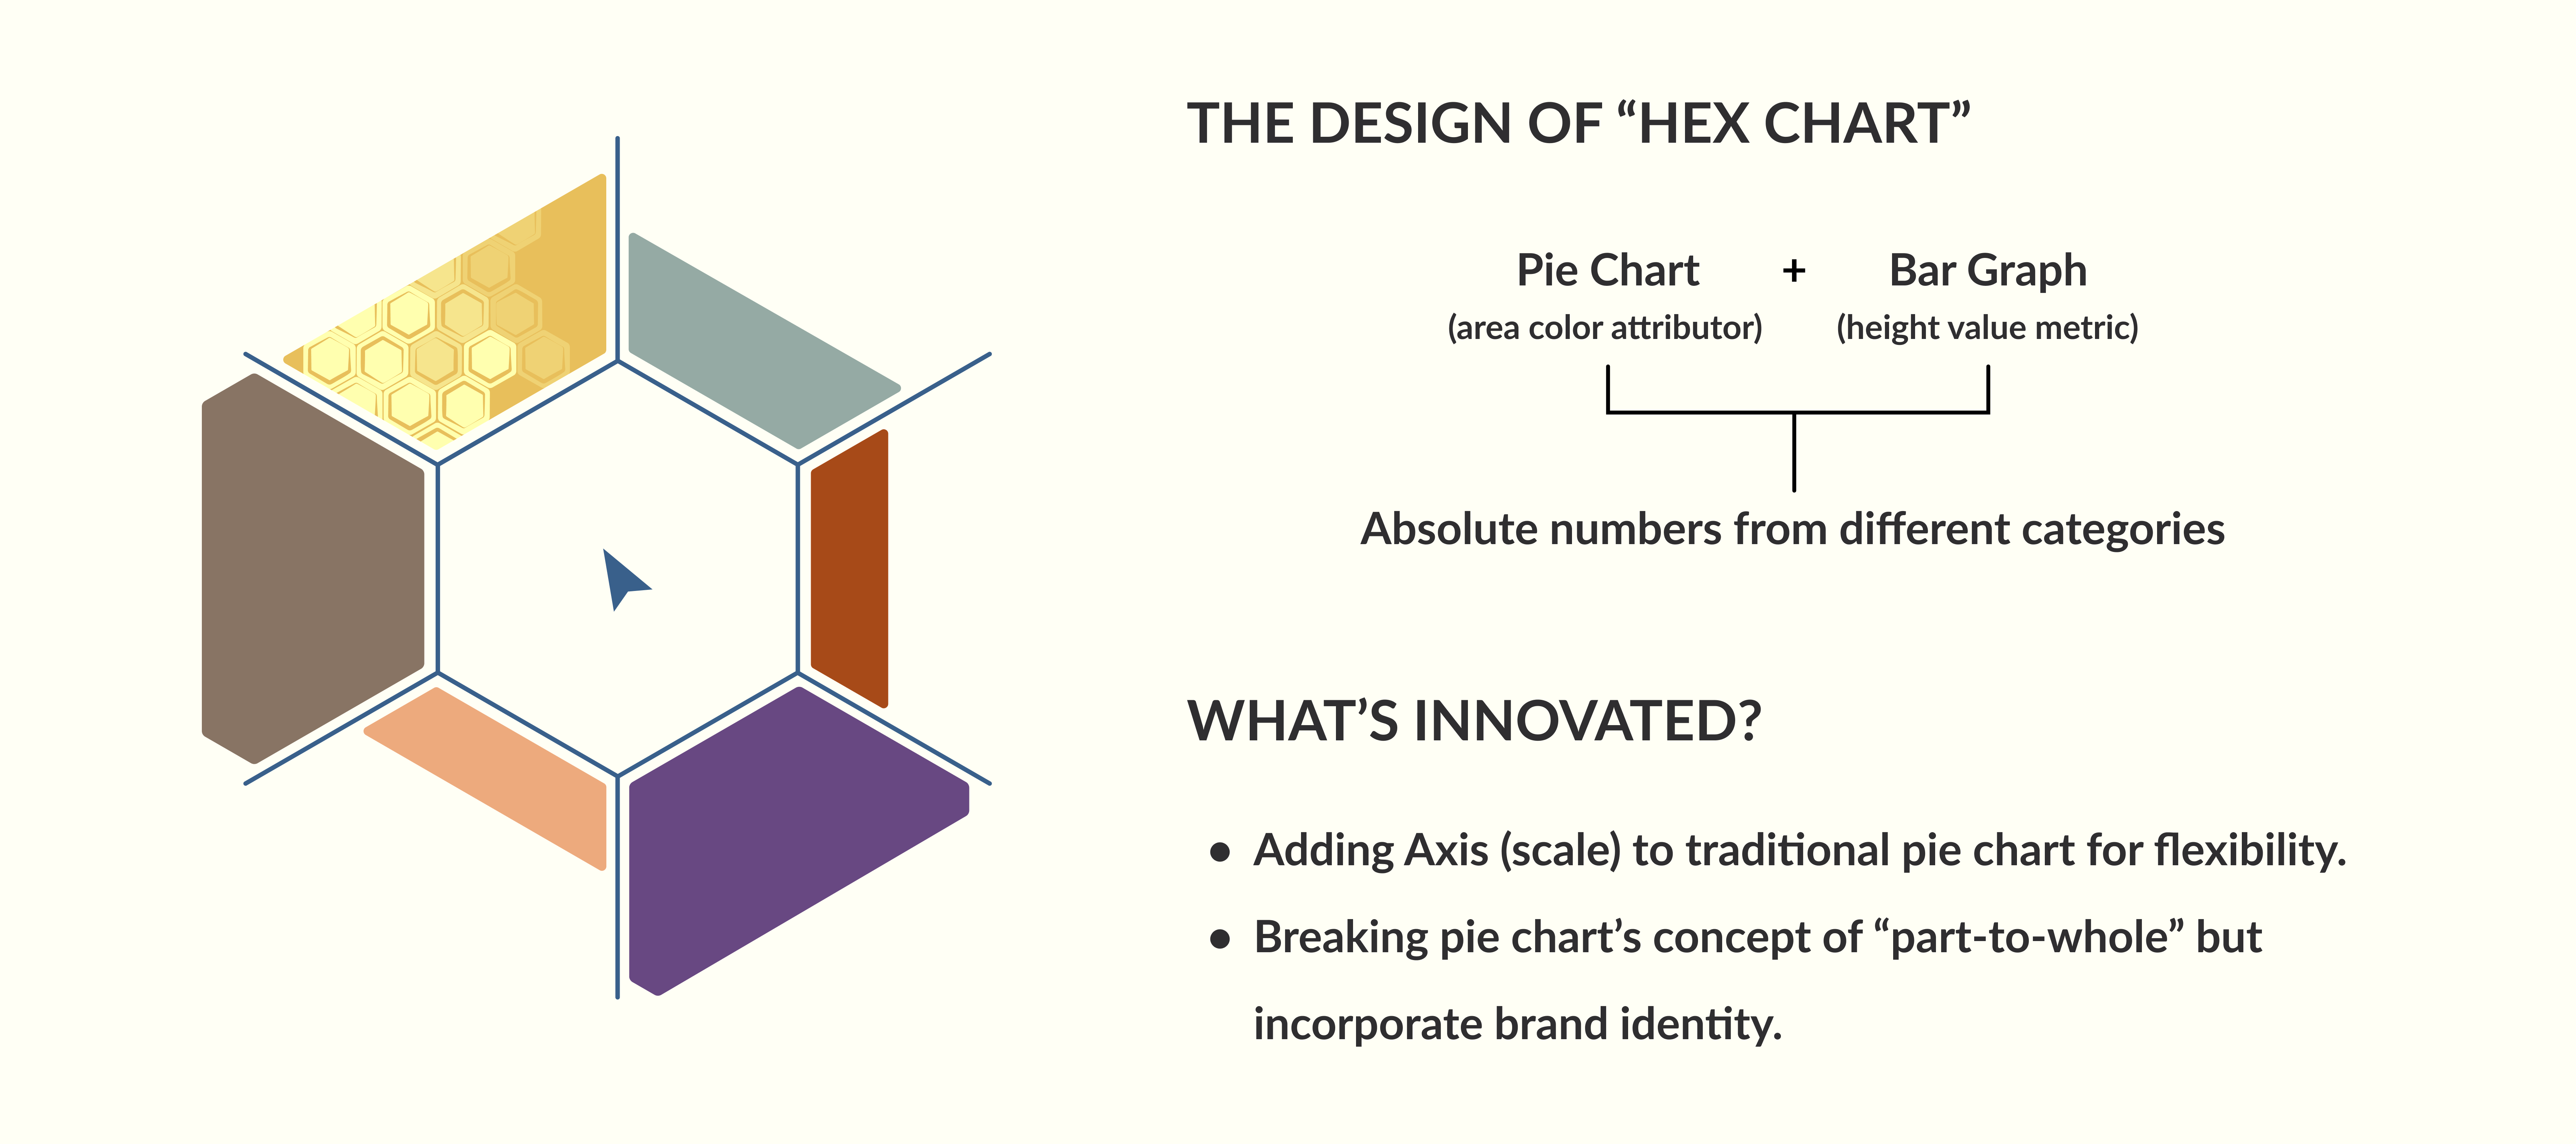
↑ FINAL “HEX CHART” WITH HOVER STATE EFFECTI extracted the characteristics from both pie chart and bar graph to create this “Hex Chart” in order to present absolute numbers from different categories. And I believe the new chart will be able to save user’s time on analyzing. During the user test, all users were able to understand the design.
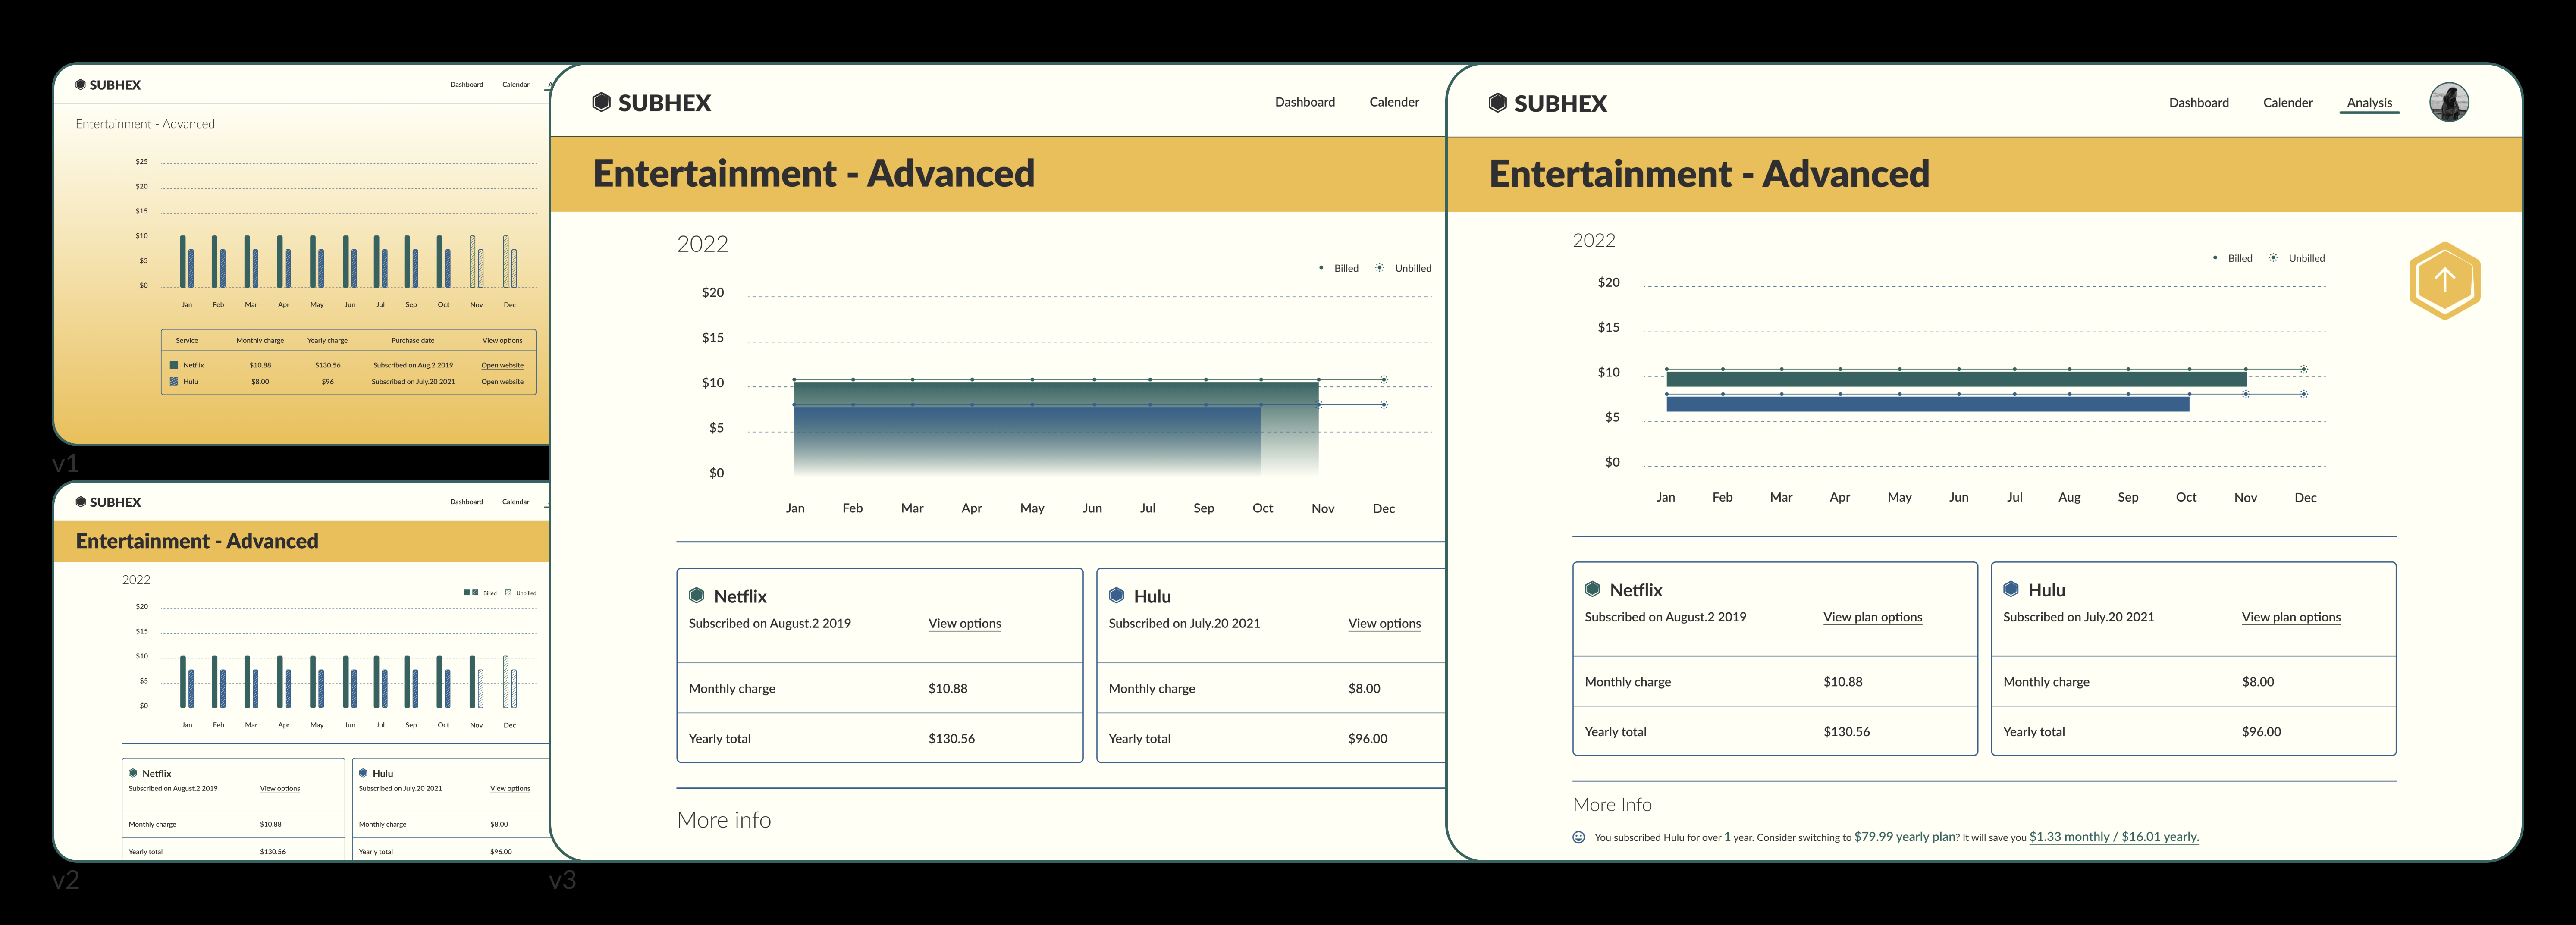
↑ ANALYSIS ADVANCEDAll users prefer v3 during the A/B test between v2 and v3. Based on user feedback, I changed the bar graph to be solid color with two reasons: 1. Match back with Analysis page’s design. 2.The ombre colored block bar might get “muddy” if there are more than 3-4 subscriptions under one category. Lastly, I revised “view options” to “view plan options” in order to give more clarification.
USER TEST ROUND 2
Game of Consistency and Accessibility
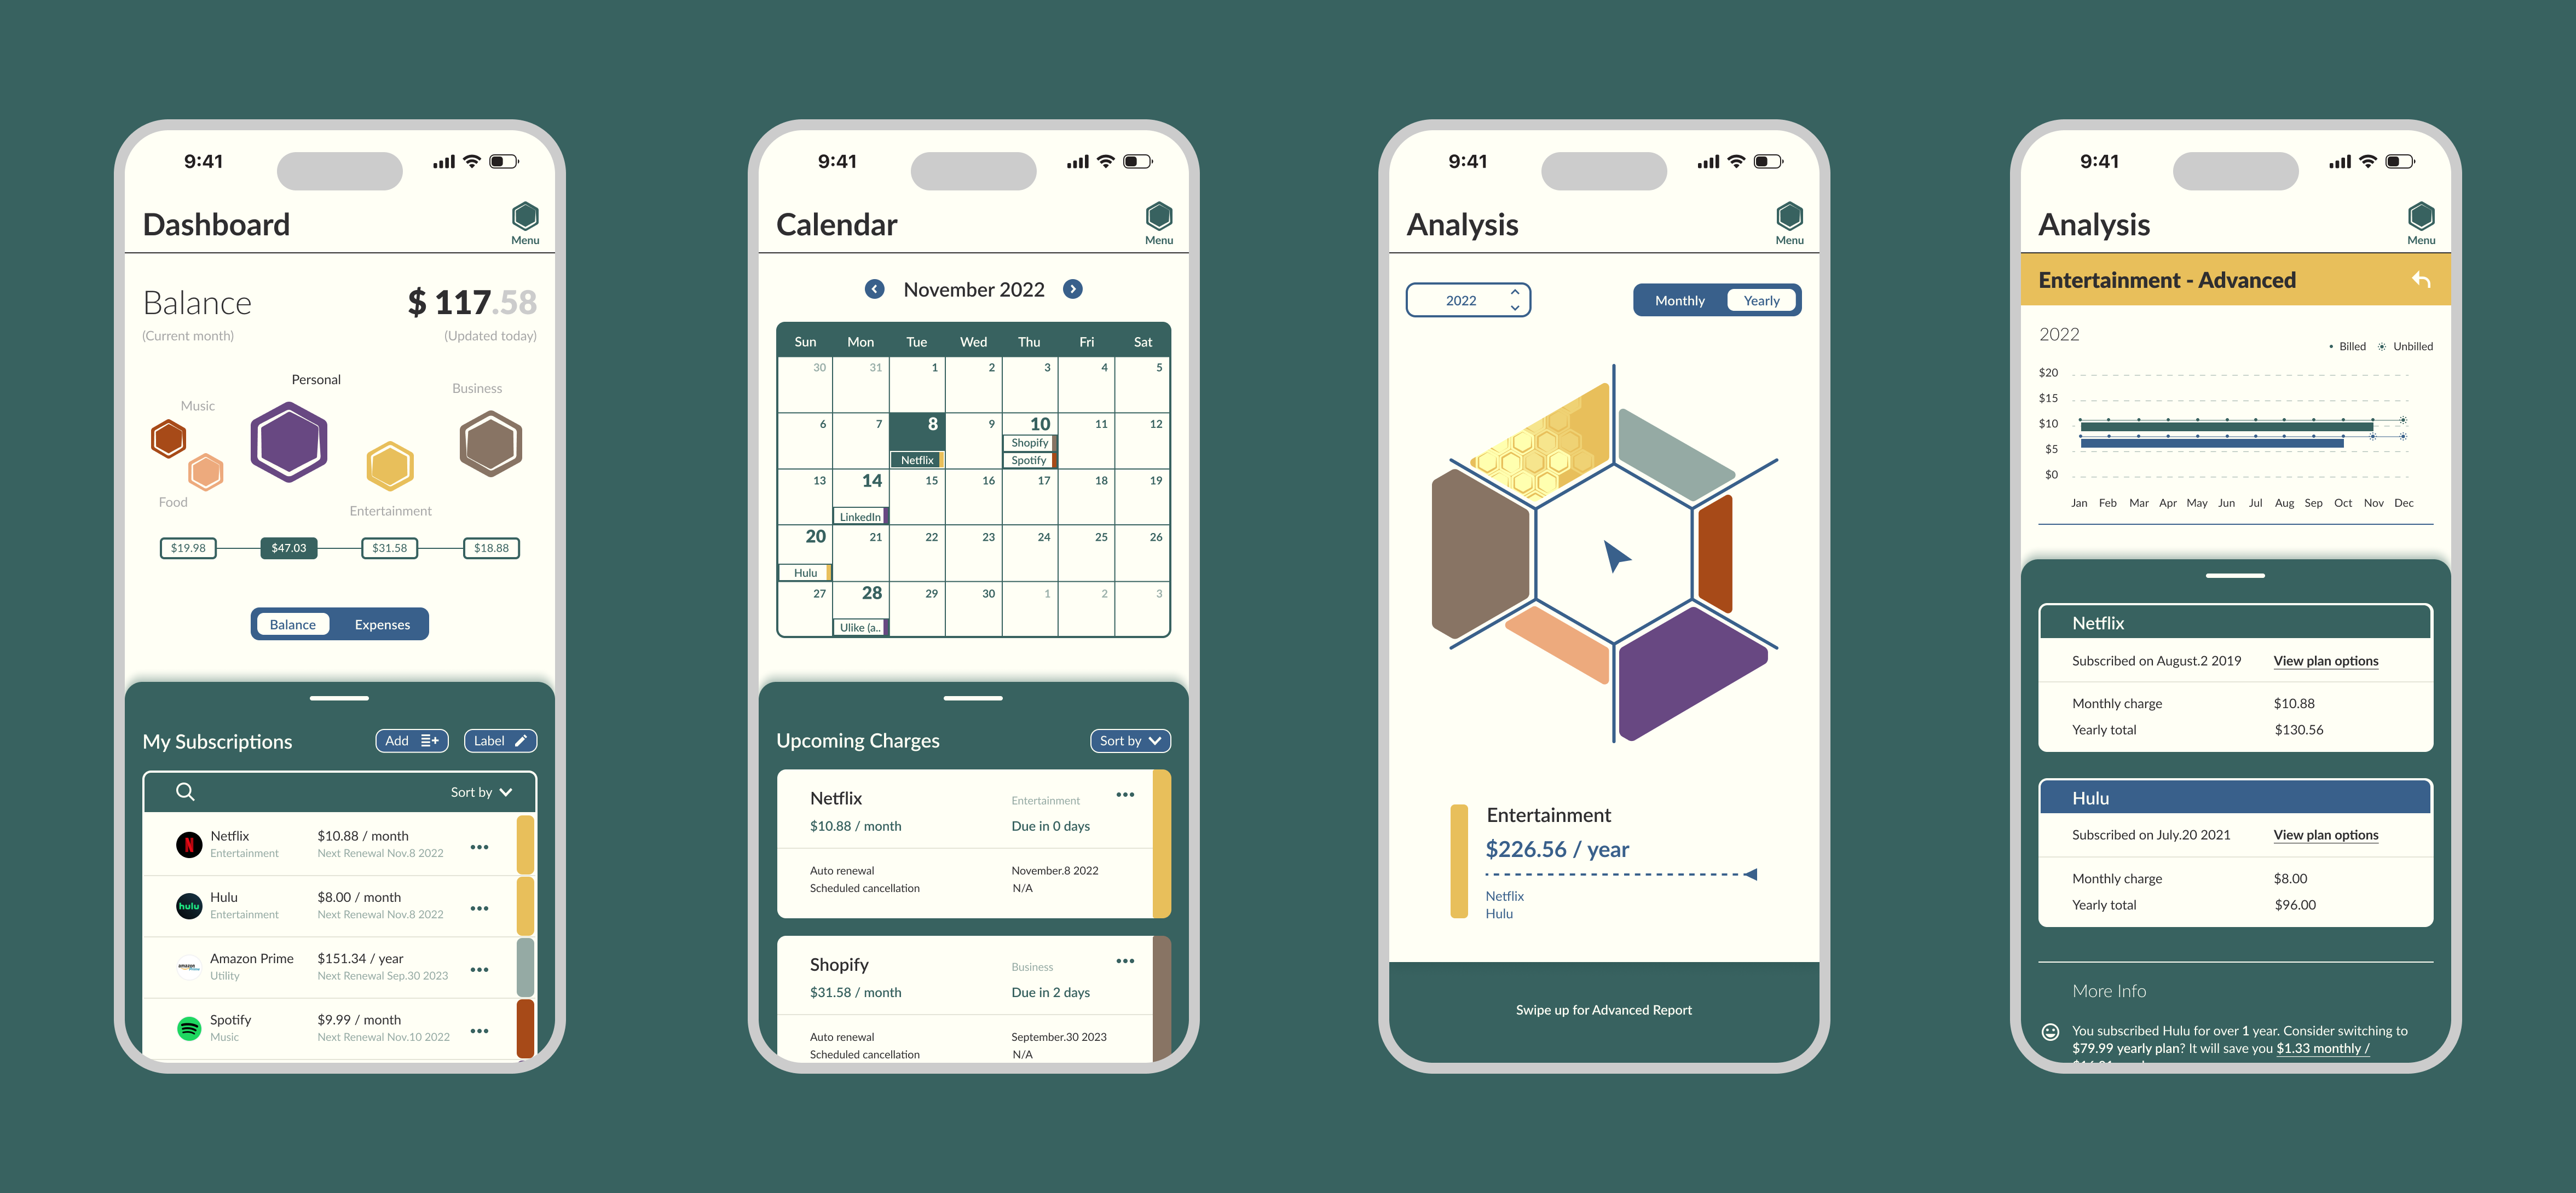
I tested the mobile version with the modified web version together in round 2. All participants preferred the mobile version because they feel it’s more on brand and visually consistent (I only show the final version here because there are no drastic changes were made). Where as the major problem for web version is too many design variations on both “color indicators” and “cards”, as well as the accessibility is still not ideal for certain pages.
The preoccupation on detail over flooded my attention on coherence
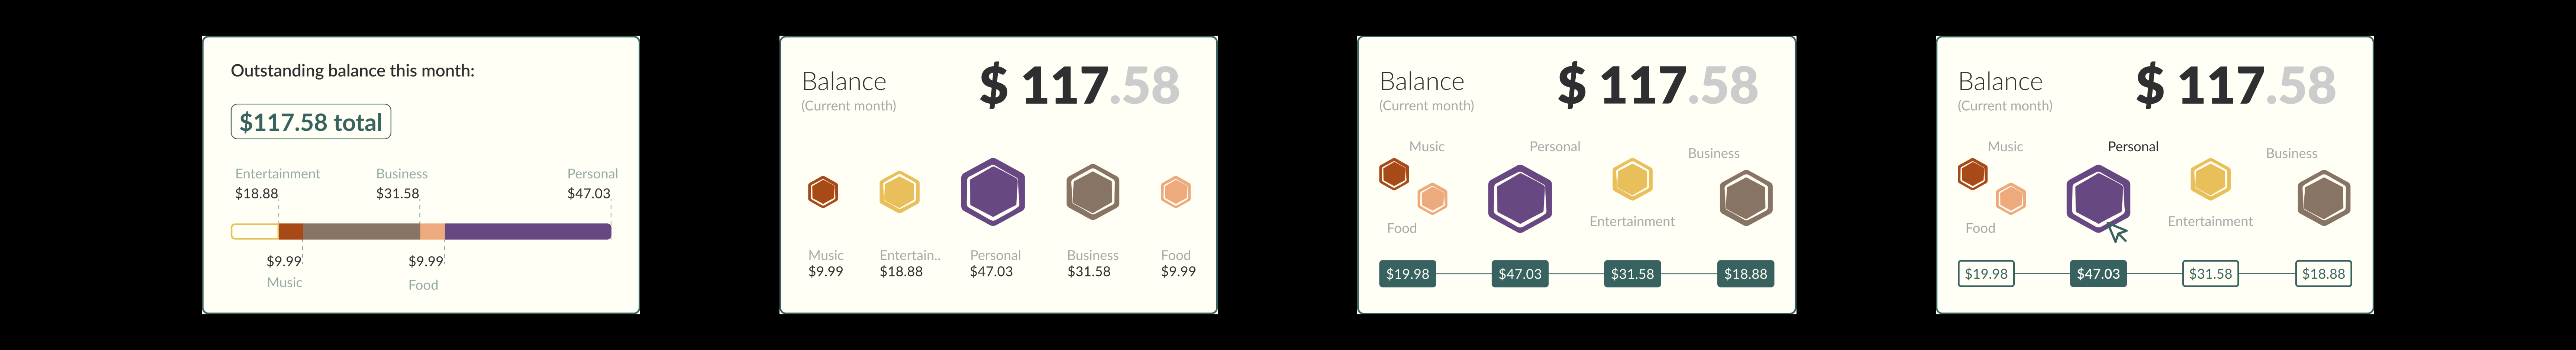
↑ Iterations on "Balance" WidgetUsers are cognitive overloaded by the design.
This widget is one of the major obstacles in round 2.
The outstanding balance number shows in green and users feel that’s “the money they have” other than “need to pay”.
The bar graph contains too much information (5 kinds) and users didn’t want to spend time studying. (Maybe this is also why they didn’t point this out directly during the 1st round)
My solutions are:
Eliminate extra information - Showing the ratio instead of progress bar.
Enhance information hierarchy - Referencing the design of “bubble chart” to create hierarchy flow and visual movement. Adding hover state to individual category for emphasis.
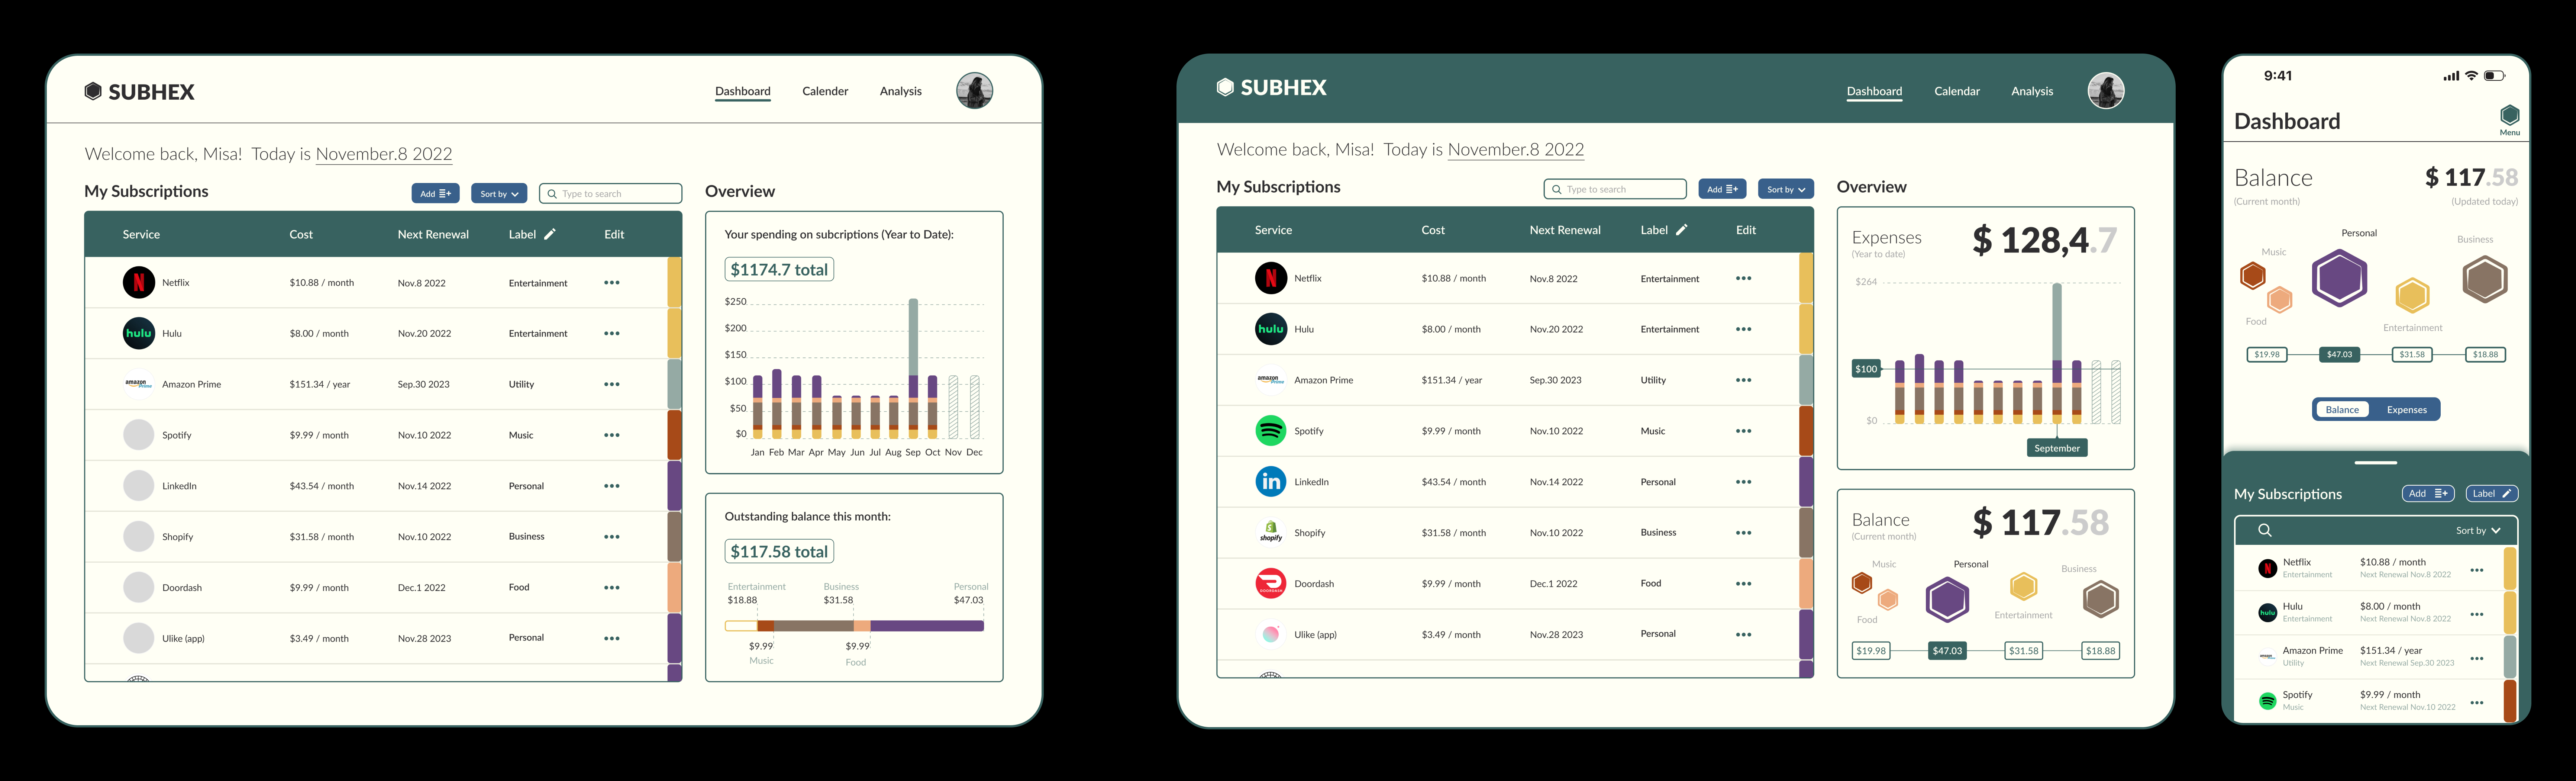
↑ DASHBOARD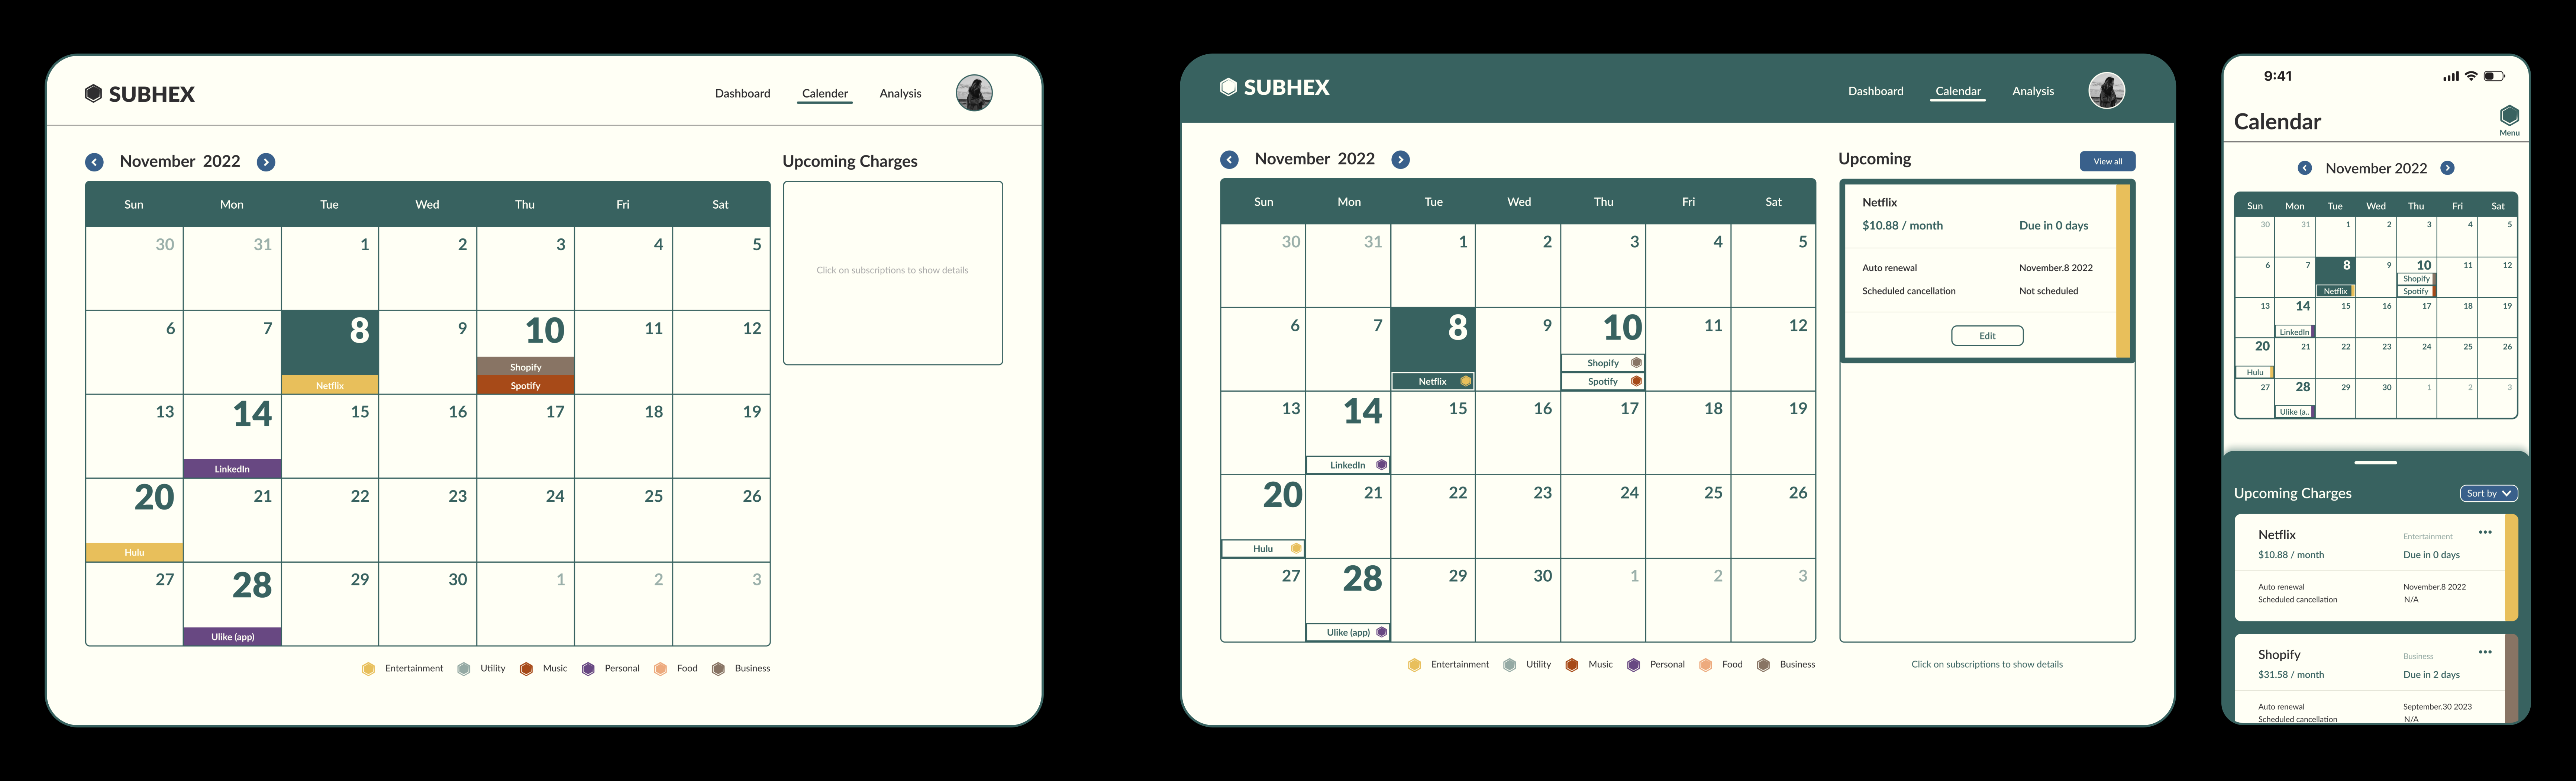
↑ CALENDARI redesigned the subscription “cards” to match with the mobile version. Also changed the ones on the calendar cells to have similar design. Added “view all” option on web page to match with same function on the mobile.
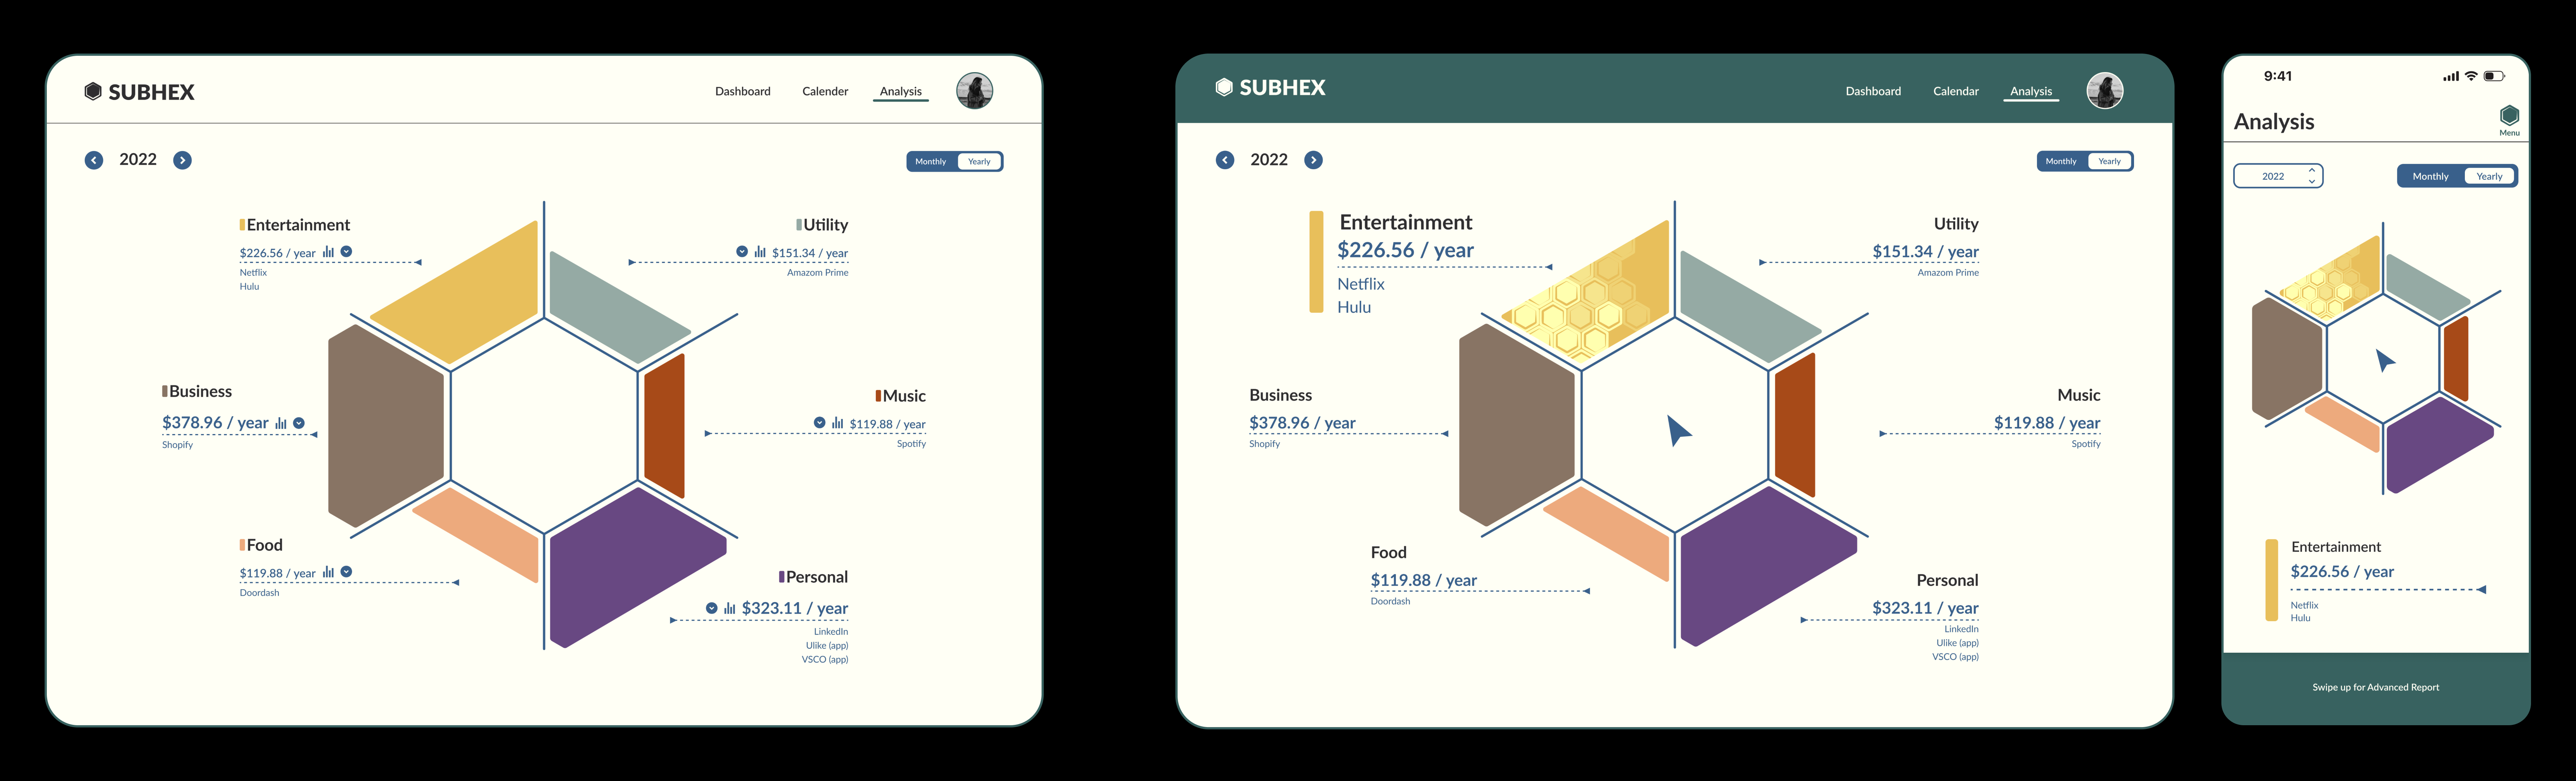
↑ ANALYSISUsers think the “arrow” for expanding the page and the color indicators are too small to be noticed. (Although there is a hover state, it’s not obvious enough) Thus I updated the indicator design, also added a “compass” in the middle.

↑ ANALYSIS ADVANCEDUsers pointed out that subscription “cards” have a different design than other pages and the mobile version. There is also concern about “What if two subscriptions have the same price?” Which I think will be my next problem to solve if I have more time on this project.
TO RECAP
The evolution of Design and Branding
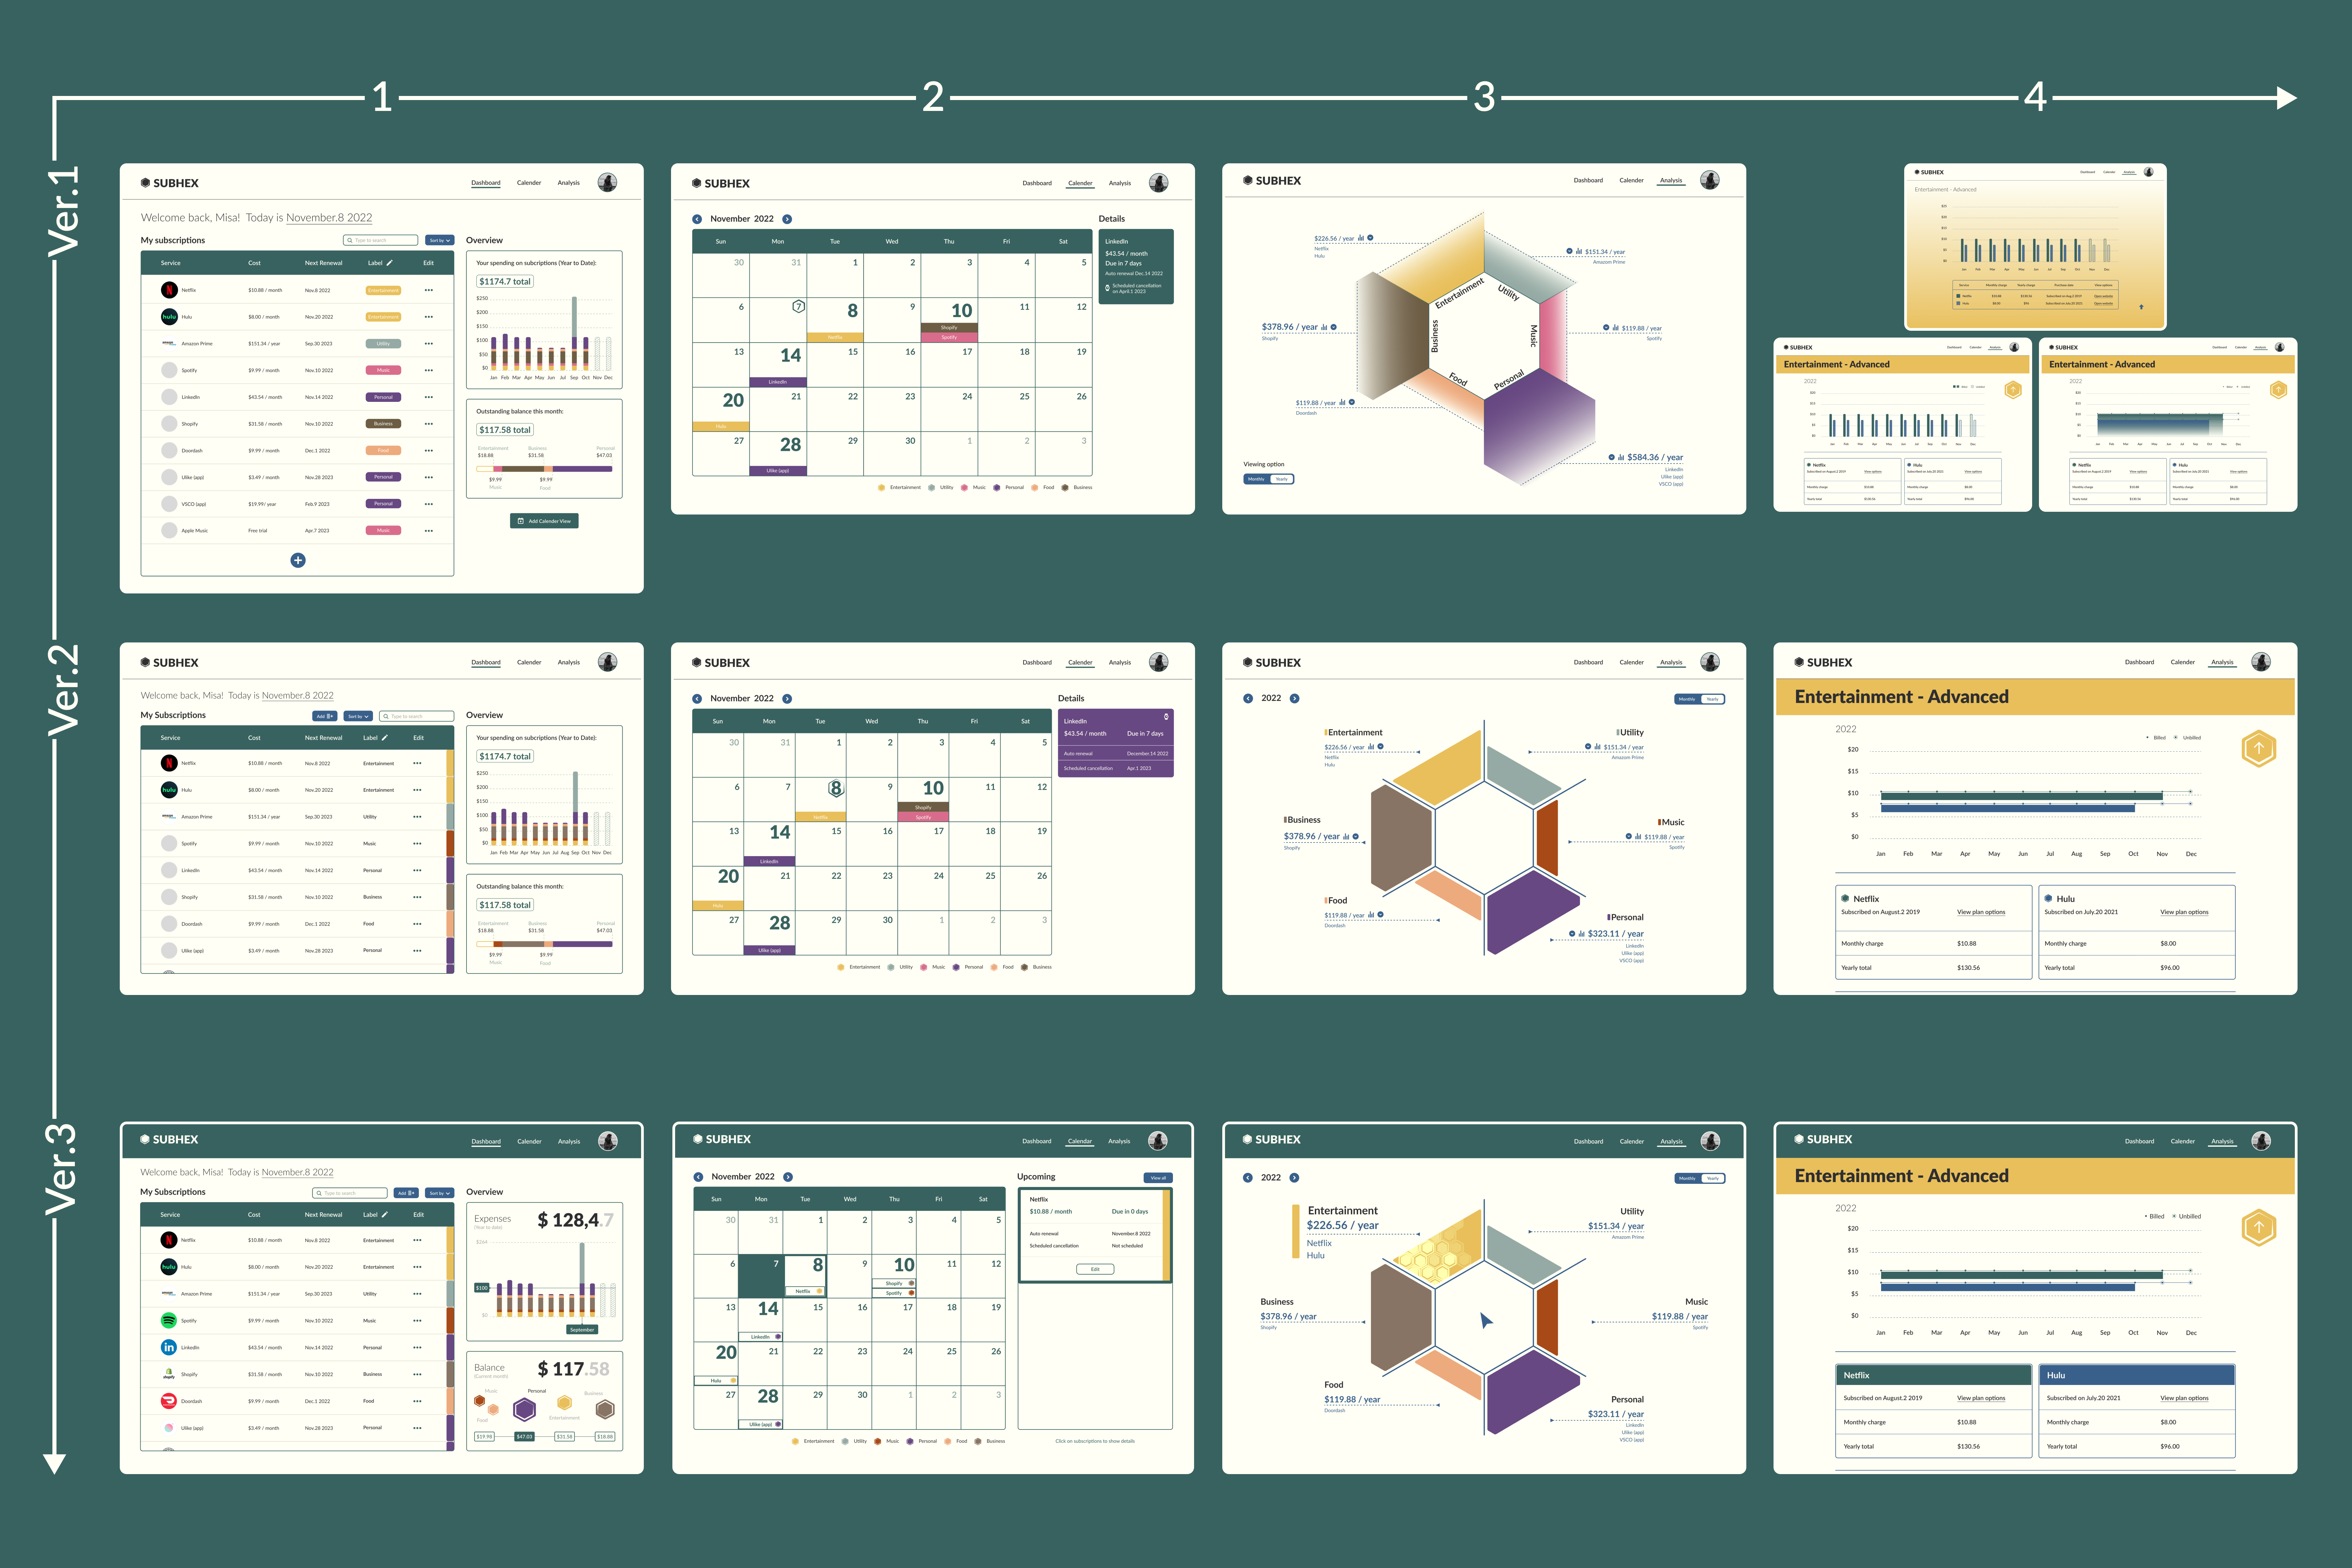
Based on the 2nd round of feedback (and pressure to move on to the next project), I believe the revised version is good enough (for now) as it met all the project deliverables. I made this chart to have a better understanding of where I started and landed. From left to right, it’s the linear sequence of pages. From top to bottom, it’s the progress of iterations. The final version carries out the branding through all pages and conveys much more clear information to users.
Create visual under the auspices of data
Prescribe system within the variations
HI-FIDELITY PROTOTYPE
SUCCESS METRIC + OPPORTUNITIES
The dashboard will affect the overall key metrics of the product , so the key performance indicators of the product itself would provide useful insights for measuring its success. In addition to measure the Retention Rate, Engagement Rate and Net Promoter Score. We can also run a survey on the dashboard with satisfaction ratings:
SUBHEX saved my time on keeping track of subscription charges
SUBHEX helped me to have a better understanding on the expenses of subscriptions
SUBHEX helped me to save money on unnecessary subscriptions and plan my subscription wisely
I assume SUBHEX is a free product as is for now. If users want to add more categories to their subscriptions or have a more detailed personal report, there will be a premium version available. Also, since subscription management is such a small side branch of finance management, SUBHEX can be used as a teaser to test the potential market for a full version finance product.
FINAL THOUGHTS
The visual poem of my mind
I am getting a little emotional writing the final thoughts about SUBHEX. I picked this project to challenge myself on the things I scared the most of - “numbers and finance-related stuff” and I know it will be a novice’s strive. But in the end, this project became my self-perception.
The timeline is tight, the problem statement might be vague, and you can find thousands of fancy dashboard designs on Dribble. I started the project just as planned, step by step. But while I was designing and making iterations, I realized “how I see and how I think” is evolving with the design. Each round of user tests made me realize some tunnel vision is constraining my design within those little widgets.
The process of:
seeing the data
⤷
digesting hierarchy
⤷
interpreting in design
feels like I’m reading a poem:
seeing the sentence
⤶
understanding literally
⤶
interpreting an image in mind
Both processes are slow and abstract, but I have to make it tangible here as a designer.
I wish I had more time. I wish I could think, sync and sink deeper with this project. But I’m still very proud of it.
Lastly, this quote from the book I just started to read resonated powerfully with me while I’m writing this case study:
"Instead of using data just to become more efficient, we argue we can use data to become more humane and to connect with ourselves and others at a deeper level.”
- <Dear Data> by Giorgia Lupi and Stefanie Posavec